Reef Central Online Community

Go Back   Reef Central Online Community > General Interest Forums > The Reef Chemistry Forum
Blogs FAQ Calendar

Notices

User Tag List

Reply
Thread Tools
Unread 01/16/2017, 05:10 AM   #1
Dan_P
Registered Member
 
Join Date: Aug 2014
Posts: 1,432
Wierd Nitrate Test Results.

In an attempt to increase the sensitivity of nitrate detection with the Salifert NO3 test, I evaporated 5 mL of tank water (no nitrates detected) under a stream of air overnight. The white residue was dissolved in 1 mL distilled water and tested. The results where about 10 ppm, the expected no more than 1 ppm (assuming the original tank water sample had less than or equal to 0.2 ppm NO3 times 5). I repeated the procedure but dissolved the residue in 5 mL distilled water to reconstitute the original tank water concentrations. The test result was 2.5 ppm or a bit less than 1/5 the 10 ppm found in the first test. How does evaporating tank water give higher nitrate readings?

Search of the literature did not help. Any and all thoughts welcome to help design investigation.


Dan_P is offline   Reply With Quote
Unread 01/16/2017, 06:53 AM   #2
Rybren
Registered Member
 
Rybren's Avatar
 
Join Date: Apr 2009
Location: Ottawa, Canada
Posts: 1,642
Maybe the N doesn't evaporate or perhaps it evaporates at a slower rate than the water; hence the concentration would rise.


__________________
120G Mixed Reef, 28G AIO zoa/pipefish tank
Rybren is offline   Reply With Quote
Unread 01/16/2017, 07:03 AM   #3
Dan_P
Registered Member
 
Join Date: Aug 2014
Posts: 1,432
Quote:
Originally Posted by Rybren View Post
Maybe the N doesn't evaporate or perhaps it evaporates at a slower rate than the water; hence the concentration would rise.
Thanks for the idea. I believe you are right. The NO3 ion would not be expected to evaporate and should become more concentrated. But what I am confused about is that there appears to be more than 10 times more nitrate than expected. I was thinking that since the color of the test sample at 0.2 ppm nitrate is very light, maybe there is just under 0.2 ppm and if I concentrate a 5 mL sample to 1 mL, 0.2 should become 1.0 ppm. Instead I measure 10 ppm. That's significantly off. Something odd is going on.


Dan_P is offline   Reply With Quote
Unread 01/16/2017, 10:14 PM   #4
bertoni
RC Mod
 
Join Date: Mar 2002
Location: Mountain View, CA, USA
Posts: 88,616
There might be some bacterial activity happening. That's my first guess, but that is a large increase in nitrate. I'm not sure what's happening.


__________________
Jonathan Bertoni
bertoni is offline   Reply With Quote
Unread 01/16/2017, 10:25 PM   #5
NewReefer42
Registered Member
 
Join Date: Mar 2016
Posts: 48
I think the problem you are facing is non-linearity w respect to the color scale. meaning, 0.2ppm is super inaccurate, but 1 or 10ppm is dead on. this could easily destroy your experiment. also, you can't increase the sensitivity of a test like this, to change sensitivity, you literally need to do different chemistry. good idea though.


NewReefer42 is offline   Reply With Quote
Unread 01/17/2017, 08:16 AM   #6
Dan_P
Registered Member
 
Join Date: Aug 2014
Posts: 1,432
Quote:
Originally Posted by bertoni View Post
There might be some bacterial activity happening. That's my first guess, but that is a large increase in nitrate. I'm not sure what's happening.
I had a vague notion that the increase might be "biological" in origin. I evaporated a larger sample and am doing a wider range of tests. PO4 is also off the charts. The pH of the reconstituted sample was 9.4. After neutralizing the sample, nitrate level was the same high level. So, it's not a testing issue.

So, cell lysis?

I will this thread with a table of test data.


Dan_P is offline   Reply With Quote
Unread 01/17/2017, 08:25 AM   #7
Dan_P
Registered Member
 
Join Date: Aug 2014
Posts: 1,432
Quote:
Originally Posted by NewReefer42 View Post
I think the problem you are facing is non-linearity w respect to the color scale. meaning, 0.2ppm is super inaccurate, but 1 or 10ppm is dead on. this could easily destroy your experiment. also, you can't increase the sensitivity of a test like this, to change sensitivity, you literally need to do different chemistry. good idea though.
I did a linearity test on the kit and it looked good down to 0.2, but yes, at the low end we are running into the limit of detection, so, who knows for sure.

The idea behind increasing the sensitivity of the test is to increase the concentration of the analyte which should be OK if something else in the sample doesn't go bad. In my initial attempt, a five fold increase in concentration gave me very much more nitrate than expected. That's why the later investigation involved reconstituting the dried sample to its original volume.

I will post a table of my latest test results.


Dan_P is offline   Reply With Quote
Unread 01/17/2017, 08:53 AM   #8
NewReefer42
Registered Member
 
Join Date: Mar 2016
Posts: 48
can you elaborate on how you determined linearity? if 0.2 is indeed the quantitation limit, I highly highly doubt that the test is linear through that range.


NewReefer42 is offline   Reply With Quote
Unread 01/17/2017, 10:15 AM   #9
bertoni
RC Mod
 
Join Date: Mar 2002
Location: Mountain View, CA, USA
Posts: 88,616
Cell lysis is a reasonable hypothesis.


__________________
Jonathan Bertoni
bertoni is offline   Reply With Quote
Unread 01/17/2017, 06:31 PM   #10
Dan_P
Registered Member
 
Join Date: Aug 2014
Posts: 1,432
Quote:
Originally Posted by NewReefer42 View Post
can you elaborate on how you determined linearity? if 0.2 is indeed the quantitation limit, I highly highly doubt that the test is linear through that range.
Serial dilution of nitrate standard and color intensity of samples determined from percent transmission of "green" light in digital image of sample and blank. Distilled water used as blank. Absorbance of sample at 0.2 ppm is different but barely so from blank.


Dan_P is offline   Reply With Quote
Unread 01/17/2017, 06:39 PM   #11
Dan_P
Registered Member
 
Join Date: Aug 2014
Posts: 1,432
Quote:
Originally Posted by bertoni View Post
Cell lysis is a reasonable hypothesis.
I am also looking at evaporated new salt water and tank water stored at pH 12.5 overnight. The latter sample is an attempt to reproduce high pH of concentrated tank water. Can't work out why pH went up.

A sample of tank water that was stored overnight looked normal except for PO4 being 0.15 ppm instead of 0.03 ppm. Your idea of bacterial activity maybe. I totally forgot to measure NH3 level. Next time.


Dan_P is offline   Reply With Quote
Unread 01/17/2017, 07:07 PM   #12
disc1
-RT * ln(k)
 
disc1's Avatar
 
Join Date: Sep 2010
Location: Little Rock
Posts: 9,705
There's an easier way to increase the range of the test. Beer's law is A = eBC. e is epsilon here, but I can't type that. It's a constant for the dye. C is your concentration, that's the leg you are messing with right now. But B is the pathlength and it seems to me that making that larger would be easier than concentrating the sample. Rework your reagents so you can do a much larger volume and run the test in a tall container.


__________________
David


Current Tank: Undergoing reconstruction...
disc1 is offline   Reply With Quote
Unread 01/17/2017, 07:09 PM   #13
NewReefer42
Registered Member
 
Join Date: Mar 2016
Posts: 48
Quote:
Originally Posted by Dan_P View Post
Serial dilution of nitrate standard and color intensity of samples determined from percent transmission of "green" light in digital image of sample and blank. Distilled water used as blank. Absorbance of sample at 0.2 ppm is different but barely so from blank.
can you elaborate on the "% transmission in digital image of sample" part? do you have a spectrophotometer? also, serial dilution of a standard is does not tell you linearity. for that, a residual plot is required.


NewReefer42 is offline   Reply With Quote
Unread 01/17/2017, 07:23 PM   #14
Dan_P
Registered Member
 
Join Date: Aug 2014
Posts: 1,432
Quote:
Originally Posted by disc1 View Post
There's an easier way to increase the range of the test. Beer's law is A = eBC. e is epsilon here, but I can't type that. It's a constant for the dye. C is your concentration, that's the leg you are messing with right now. But B is the pathlength and it seems to me that making that larger would be easier than concentrating the sample. Rework your reagents so you can do a much larger volume and run the test in a tall container.
I agree on increasing path length and tried this with materials at hand or that easily and cheaply available. Results were disappointing. I am not ready to spend big bucks on very long glass cell. So, I suspended the approach of a very long cell for now.


Dan_P is offline   Reply With Quote
Unread 01/17/2017, 07:45 PM   #15
Dan_P
Registered Member
 
Join Date: Aug 2014
Posts: 1,432
Quote:
Originally Posted by NewReefer42 View Post
can you elaborate on the "% transmission in digital image of sample" part? do you have a spectrophotometer? also, serial dilution of a standard is does not tell you linearity. for that, a residual plot is required.
I built a light box that produces an evenly dispersed light off its back wall. The blank and sample sit several inches in front of the wall. This "scene" is photograped, adjusting the exposure to avoid saturating the sensor. Then the RGB values are read at a predetermined location on the vials, the same on both the sample and blank. By photographing two blanks and switching them around and rephotographing them, I convinced myself that the light through both sample vials was the same. Variation in measuring the % transmittance raises the limit of color detection to a bit higher than the human eye for all colorimetric tests I have investigated so far. Limit of detection here means either I or the camera can detect a color.

My definition of linearity is suitable for my needs at this time. I am looking for trends, and only interested in discovering big changes. I guess my approach might be classified as "semi-quantitative", or is that an oxymoron?


Dan_P is offline   Reply With Quote
Unread 01/17/2017, 07:50 PM   #16
NewReefer42
Registered Member
 
Join Date: Mar 2016
Posts: 48
Quote:
Originally Posted by Dan_P View Post
I built a light box that produces an evenly dispersed light off its back wall. The blank and sample sit several inches in front of the wall. This "scene" is photograped, adjusting the exposure to avoid saturating the sensor. Then the RGB values are read at a predetermined location on the vials, the same on both the sample and blank. By photographing two blanks and switching them around and rephotographing them, I convinced myself that the light through both sample vials was the same. Variation in measuring the % transmittance raises the limit of color detection to a bit higher than the human eye for all colorimetric tests I have investigated so far. Limit of detection here means either I or the camera can detect a color.

My definition of linearity is suitable for my needs at this time. I am looking for trends, and only interested in discovering big changes. I guess my approach might be classified as "semi-quantitative", or is that an oxymoron?
semi-quantitative is indeed a correct term. a couple other monkey wrenches for you though. 1) did you check your cameras sensor linearity? flashlight, tinfoil with a pinhole in it, dark room and you can find out. 2) are you saving the images as .raw or equivalent? if not, the jpg compression artifacts could skew your data. if you're doing photometric this way, you should indeed be able to use the beers law trick to get a lower quant limit.


NewReefer42 is offline   Reply With Quote
Unread 01/17/2017, 08:13 PM   #17
Dan_P
Registered Member
 
Join Date: Aug 2014
Posts: 1,432
Quote:
Originally Posted by NewReefer42 View Post
semi-quantitative is indeed a correct term. a couple other monkey wrenches for you though. 1) did you check your cameras sensor linearity? flashlight, tinfoil with a pinhole in it, dark room and you can find out. 2) are you saving the images as .raw or equivalent? if not, the jpg compression artifacts could skew your data. if you're doing photometric this way, you should indeed be able to use the beers law trick to get a lower quant limit.
I have not checked the camera's linearity and I am trusting my luck with JPG compression for now. Thanks for pointing these out though. Good to know all the ways that your methods can deceive you.


Dan_P is offline   Reply With Quote
Unread 01/22/2017, 11:09 AM   #18
Dan_P
Registered Member
 
Join Date: Aug 2014
Posts: 1,432
Just to finish off this thread, here are the test results. Compare "dried" vs "stored" results for each sample type in the table. "NSW (old)" refers to new salt water that is about a month old while "NSW (new)" is freshly prepared salt water. The water was analyzed after it was "dried", "stored" in a 3 dram bottle over night or in one case the pH was increased to 12.5 overnight in a 3 dram vial before it was neutralized.

Clearly, the act of drying the salt water samples under a stream of air over a 24 hour period gave curiously high nitrate, ammonia and phosphate readings compared to just storing the same sample of water in a 3 dram vial. Just storing samples in capped vials increased the PO4 reading.

I had originally hoped that concentrating tank water samples would enable me to measure lower levels of nitrates. I ended up with a bit of a mess. I will be back to this topic when I sort the phosphate measurements. I have probably stumbled on what is already known: I am likely seeing meta and some organophosphates being converted to orthophosphate. More later.


Dan_P is offline   Reply With Quote
Unread 
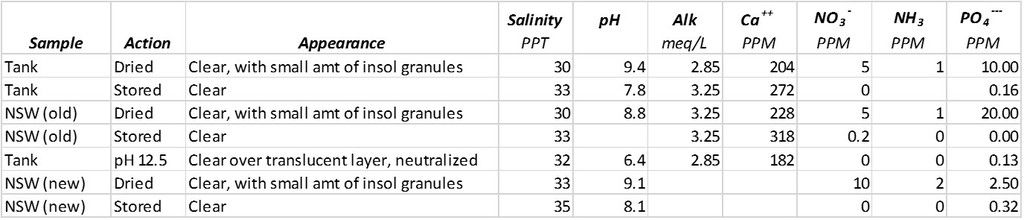
02/25/2018, 06:37 PM   #19
Dan_P
Registered Member
 
Join Date: Aug 2014
Posts: 1,432
Wierdness Possibly Solved

Over the past year, I performed enough experiments to suggest an answer. Jonathan’s suggestion looks like the winner.

When I store a capped or open 200 mL sample of tank water in the dark for a week, NH3, NO3 and PO4 levels do not change. But if air is bubbled through the sample (evaporated water replaced daily with RO/DI), NH3 and NO3 levels begin to rise between days 2 and 4. I repeated the experiment for twenty days with the same results, ending with 1 ppm NH3, 5 ppm NO3 and 0.1 ppm PO4. There didn’t seem to be a leveling off of the rate of NH3 or NO3 production. The solutions were slightly cloudy. I centrifuged the floc and examined it under a microscope. I saw very small cells. I am going to repeat the experiment one more time at 200 mL and look for a leveling off of NH3 production.

Possible implications. (1) I cannot just evaporate tank water to to get a more concentrated solution of NO3 or PO4. (2) There seems to be a lot of biomass in my water. About 2 ppm of nitrogen was liberated by the end of my 20 day tank water experiment, even though nitrate and ammonia are undetectable at the start of the experiment. If nitrogen makes up ~8% of biologically derived matter, there is about 24 ppm of biomass in the water, or about 10 ppm TOC from the biomass. (3) If I get an occassional spike in nitrate level, it could just be a result of a small die off of biomass in the water rather than something in the sand (Though the origin doesn’t matter. I never “do” anything in response to NO3 spikes)


Dan_P is offline   Reply With Quote
Unread 02/25/2018, 06:57 PM   #20
bertoni
RC Mod
 
Join Date: Mar 2002
Location: Mountain View, CA, USA
Posts: 88,616
That's interesting. I wonder how many other tanks have a similar amount of TOC in the water column. Maybe most of them?


__________________
Jonathan Bertoni
bertoni is offline   Reply With Quote
Unread 02/25/2018, 07:34 PM   #21
Dan_P
Registered Member
 
Join Date: Aug 2014
Posts: 1,432
Quote:
Originally Posted by bertoni View Post
That's interesting. I wonder how many other tanks have a similar amount of TOC in the water column. Maybe most of them?
I am also wondering how general this test might be. Is this a “poor man’s” way of estimating TOC? Lot more work to do to answer that question.

Feldman in Advance Aquarist reported values for TOC in aquaria and reefs. 10 ppm is not way off from those values.


Dan_P is offline   Reply With Quote
Reply


Posting Rules
You may not post new threads
You may not post replies
You may not post attachments
You may not edit your posts

BB code is On
Smilies are On
[IMG] code is On
HTML code is On


All times are GMT -6. The time now is 09:53 PM.


Powered by vBulletin® Version 3.8.4
Copyright ©2000 - 2024, Jelsoft Enterprises Ltd.
Powered by Searchlight © 2024 Axivo Inc.
Use of this web site is subject to the terms and conditions described in the user agreement.
Reef CentralTM Reef Central, LLC. Copyright ©1999-2022
User Alert System provided by Advanced User Tagging v3.3.0 (Pro) - vBulletin Mods & Addons Copyright © 2024 DragonByte Technologies Ltd.